Data Analytics Tools help beginners collect, clean, explore, and understand data faster, turning confusing numbers into clear decisions that improve confidence, productivity, and business results.
Why beginners feel overwhelmed at first
Data Analytics Tools can feel intimidating when you first meet them because the interface, menus, charts, and metrics often seem built for experts. Many beginners think they need to understand everything at once, but that is not true. The real goal is to start with a small set of features that help you answer simple questions clearly.
The best way to approach Data Analytics Tools is to stop seeing them as complicated software and start seeing them as problem-solving systems. A beginner does not need to master every dashboard or technique on day one. It is enough to learn how data moves from raw input to meaningful insight and then use that insight to make a better decision.
What Data Analytics Tools actually do
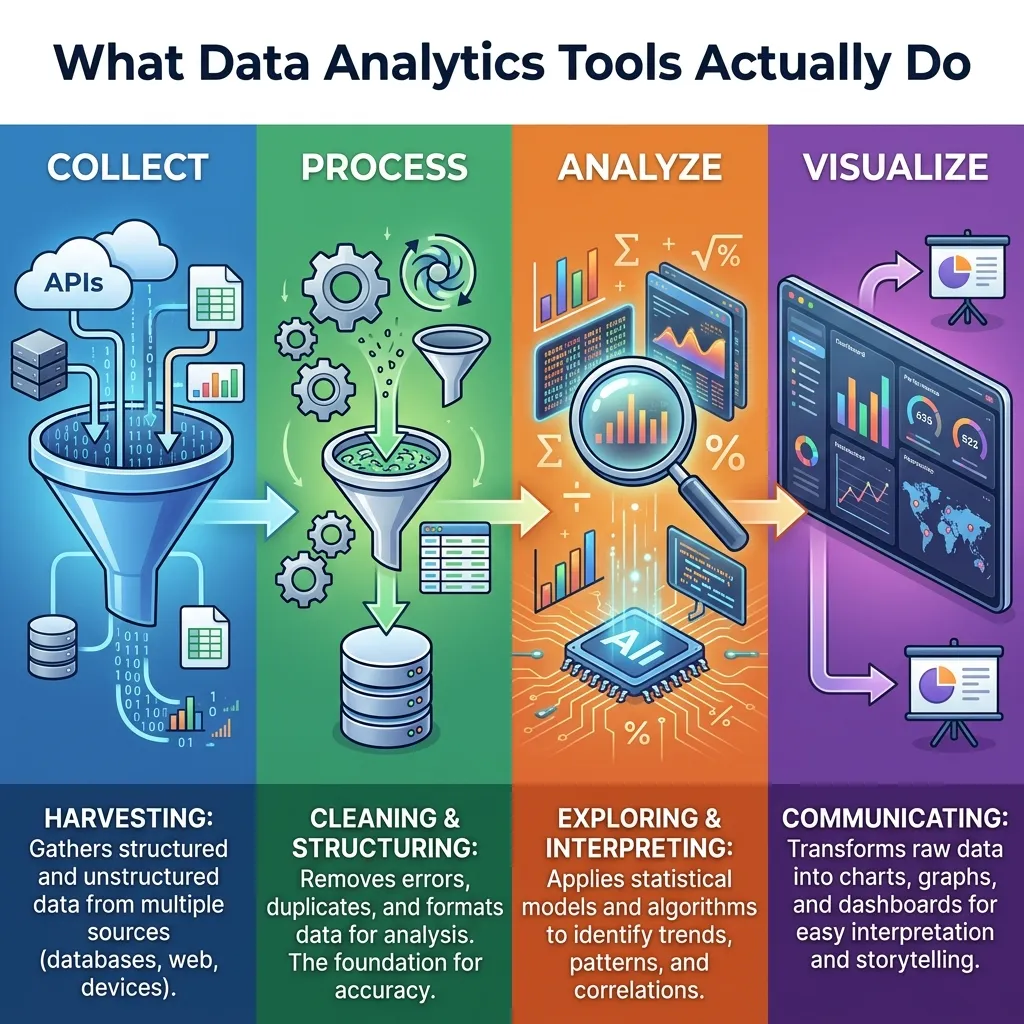
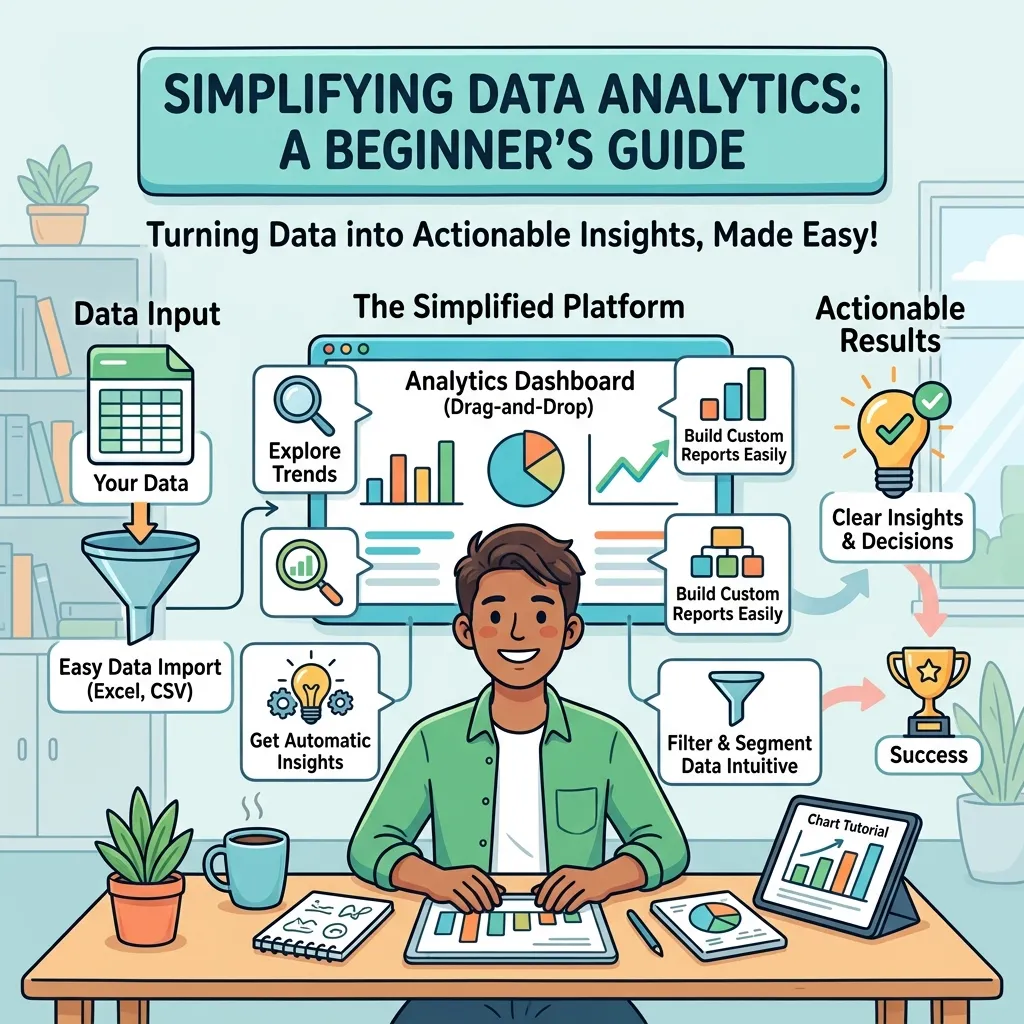
At a basic level, Data Analytics Tools help you import data, organize it, analyze it, visualize it, and share the outcome with others. They may connect to spreadsheets, databases, websites, or apps, depending on the platform. Once the data is inside the tool, you can sort it, filter it, compare it, and look for patterns that are hard to spot manually.
Another important role of Data Analytics Tools is reducing friction. Without them, beginners often waste time copying numbers between sheets or trying to interpret incomplete reports. With the right tool, the process becomes smoother because the software handles much of the repetitive work. That leaves more time for understanding what the data is saying and what action should come next.
Why simplicity matters more than features
Many people choose Data Analytics Tools by comparing long feature lists, but beginners usually benefit more from simplicity than from complexity. A tool with too many advanced options can slow learning and create frustration. A simpler dashboard with clear labeling often teaches better because it reduces mental load and keeps the user focused on the question, not the interface.
When beginners feel lost, they often assume they are not “data people.” In reality, the problem is usually the environment, not the person. Data Analytics Tools are easiest to learn when they present one task at a time. That is why beginner-friendly systems often outperform powerful but crowded platforms for early learning.
The beginner learning path
The first step with Data Analytics Tools is to understand what problem you want to solve. Do you want to track website traffic, compare sales by product, measure email performance, or understand customer behavior? A clear goal gives the tool direction and keeps you from exploring random features that do not help.
The second step is to learn the basic workflow. Most Data Analytics Tools follow a similar pattern: bring data in, clean it, analyze it, and display the result. Once that flow feels familiar, the software becomes much less frightening. Beginners often gain confidence quickly once they realize the same logic applies across many platforms.
The third step is practice with small datasets. Data Analytics Tools become easier when you start with a simple spreadsheet instead of a massive report. Small examples help you see how formulas, charts, filters, and summaries behave. This builds intuition and makes larger datasets less overwhelming later.
Common types of Data Analytics Tools
There are several broad categories of Data Analytics Tools, and beginners should understand them before choosing one.
| Type | What it does | Beginner value |
|---|---|---|
| Spreadsheet tools | Basic sorting, formulas, charts | Easy entry point |
| BI dashboards | Visual reporting and exploration | Clear business summaries |
| SQL-based tools | Query structured data | Strong for precise analysis |
| Python/R tools | Advanced analysis and modeling | Powerful for future growth |
| Web analytics tools | Track traffic and user behavior | Great for marketing insights |
Each category of Data Analytics Tools serves a different purpose. A spreadsheet is often enough for a beginner who just wants to organize data and create simple charts. A dashboard tool may be better when the goal is to monitor performance regularly. More advanced tools can wait until the user understands the core concepts.
Choosing the right tool for your first project
Beginners should not start with the most advanced option available. Data Analytics Tools are best selected based on the problem, the data source, and the level of comfort the user already has. If the data already lives in spreadsheets, a spreadsheet-based workflow may be the fastest path to understanding. If the data must be pulled from a website or platform, a reporting or dashboard tool may be more useful.
The best beginner choice is usually the one that feels immediately useful. Data Analytics Tools are easier to learn when the output matters to you personally. For example, if you want to understand sales, website visits, or campaign results, the motivation is stronger because the insight has a direct purpose. That makes the learning process less abstract and far more rewarding.
Data collection and why it matters
Data Analytics Tools are only as good as the data they receive. If the input is messy, incomplete, or inconsistent, the result will be weak. Beginners often focus on the chart and ignore the source, but clean input is where good analysis really begins. Learning to check for missing values, duplicate records, and inconsistent labels is one of the most valuable early habits.
It also helps to understand where your data comes from. Data Analytics Tools may work with internal sales records, website events, form submissions, social metrics, or survey responses. Knowing the source helps you judge reliability. Beginners who learn this early make fewer mistakes because they stop treating all data as equally trustworthy.
Cleaning data without getting stuck
One of the most important beginner skills is cleaning data. Data Analytics Tools often include filters, find-and-replace options, formatting controls, and duplicate removal features. These functions do not feel exciting, but they have a huge effect on the quality of the analysis. Messy data can create misleading conclusions even when the chart looks polished.
A beginner should learn to ask a simple question before every analysis: does this dataset make sense? Data Analytics Tools become much more useful when you verify that names, numbers, dates, and categories are consistent. Small cleaning habits save time later and make the final output easier to trust.
How to think about charts and visuals
Charts are one of the most useful parts of Data Analytics Tools because they turn abstract numbers into visible patterns. A line chart can show growth over time, a bar chart can compare categories, and a pie chart can show distribution when the number of categories is small. The beginner’s job is not to make every chart fancy. It is to make the message easy to understand.
Data Analytics Tools often tempt users to over-design visuals, but clarity should always come first. A simple chart with a clear title and readable labels usually communicates better than a complicated graphic filled with unnecessary effects. Beginners should learn to ask: what question does this chart answer? If the answer is not obvious, the visual needs improvement.
Learning from dashboards instead of drowning in them
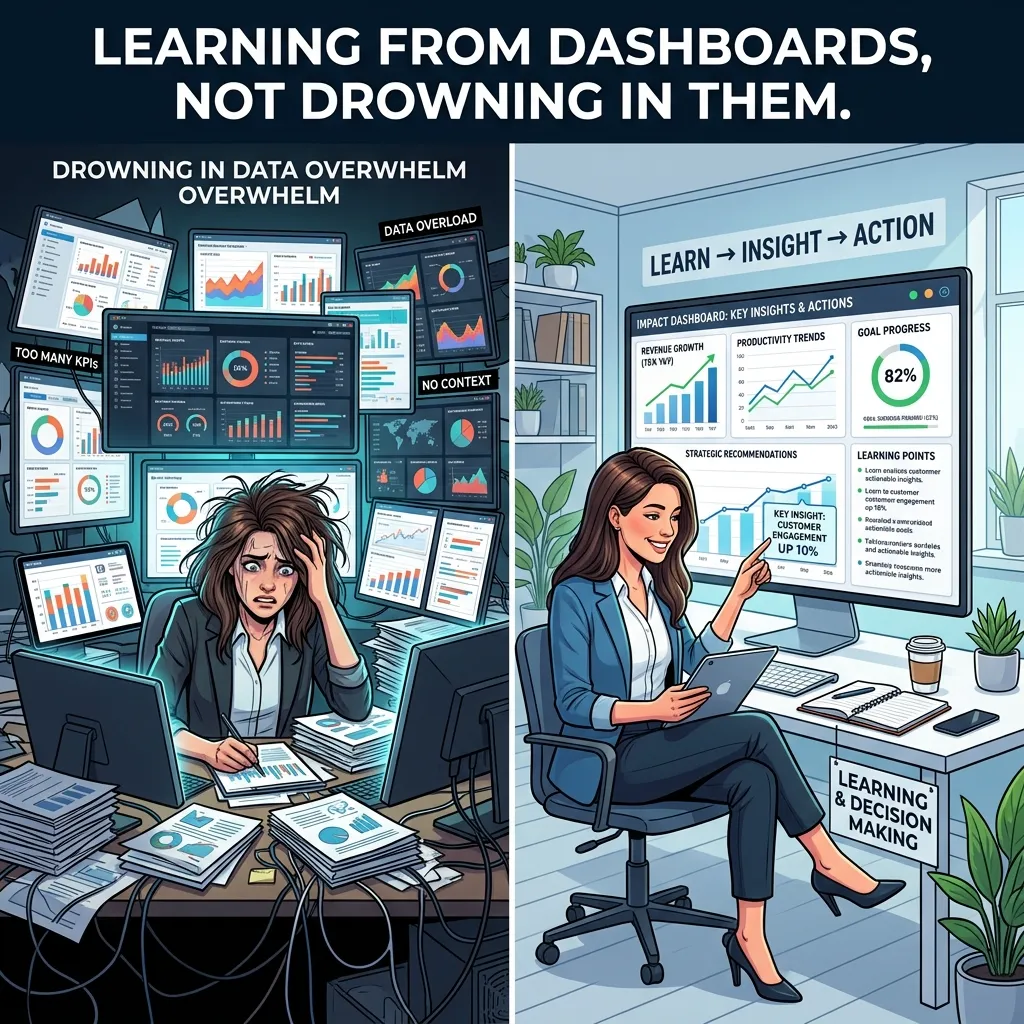
Dashboards are powerful because they collect multiple metrics in one place. Data Analytics Tools with dashboard features can help beginners monitor performance without opening ten different reports. That is useful for marketing, operations, finance, and sales because it brings the most important numbers into one view.
Still, dashboards can become overwhelming if they include too many widgets. Beginners should choose only the metrics that matter most. Data Analytics Tools are more effective when the dashboard has a purpose. A focused dashboard helps the user notice trends quickly and prevents decision fatigue caused by too much information.
Understanding basic metrics
Beginners do not need to memorize every statistical term on the first day. Data Analytics Tools often use a smaller set of common metrics that show up again and again. These may include totals, averages, percentages, growth rates, conversion rates, and comparisons by category. Once you understand those basics, you can read a surprising number of reports with confidence.
The value of Data Analytics Tools grows when you connect metrics to real behavior. A conversion rate is not just a number; it tells you how many people took action. A traffic spike is not just a chart; it may reveal a campaign, a trend, or a new audience segment. Beginners should always ask what the metric means in real life.
A beginner-friendly workflow
A simple workflow makes Data Analytics Tools much easier to use. Start by defining the question. Then gather the data, clean it, inspect it, visualize it, and summarize the result in plain language. This pattern works for most entry-level analysis tasks and prevents the user from jumping randomly between screens.
The more often you repeat this workflow, the more natural Data Analytics Tools feel. Beginners gain confidence when the process becomes familiar because the software starts to feel like a helper rather than a test. The point is not to become perfect immediately. The point is to create a repeatable path from raw data to useful insight.
Where beginners often make mistakes
One common mistake is trying to analyze too much at once. Data Analytics Tools can process large datasets, but beginners often learn faster by focusing on one question per session. Another mistake is trusting every result without checking the source. Good analysis requires a little skepticism, even when the numbers look clean.
A third mistake is choosing style over usefulness. Data Analytics Tools may offer many visual options, but flashy charts can hide the point instead of revealing it. Beginners should prioritize readable labels, accurate scales, and honest summaries. A clear chart with one message is worth more than a beautiful chart that confuses the viewer.
A practical example for beginners
Imagine you want to understand which product category sells best. Data Analytics Tools can help you import sales data, group it by category, sum revenue, and create a bar chart. That single analysis answers a practical question quickly and shows how the software supports decision-making. This is the kind of small win that builds confidence.
If you want to go one step further, you can compare the same categories by month or region. Data Analytics Tools make this easy because they let you slice data in different ways. That teaches beginners that analysis is not about one perfect chart. It is about asking a question, testing it, and learning from the answer.
Data Analytics Tools for marketing beginners
Marketing is one of the easiest places for beginners to see value. Data Analytics Tools can show website visits, ad clicks, email opens, and conversion rates. That means you can see which messages get attention and which channels perform best. For new marketers, this is a fast way to connect action with outcome.
This is also where Email Marketing Tips become useful, because email data is often one of the clearest examples of simple analysis. Open rates, click rates, and reply rates can show what kind of subject line or message works best. Data Analytics Tools help turn those signals into better future campaigns.
Data Analytics Tools for sales and operations
Sales teams use Data Analytics Tools to understand pipeline movement, deal size, conversion patterns, and customer behavior. Operations teams use them to monitor inventory, delays, output, and efficiency. In both cases, the power comes from seeing patterns early enough to respond. Beginners in these fields often start with reports they already use every day.
If the goal is product performance, you may also need to Optimize Product Listings for Marketplaces. Data Analytics Tools can reveal which titles, descriptions, and categories drive clicks or conversions. That makes the analysis practical because the insight leads directly to better marketplace performance, not just a prettier report.
Learning speed depends on habit
Beginners improve faster when they practice regularly, even if the sessions are short. Data Analytics Tools are easier to master through repetition than through long theory sessions. Ten minutes a day with one dataset can be more valuable than a three-hour class that leaves you exhausted.
The reason habit matters is that Data Analytics Tools require pattern recognition. Over time, you start to notice where data is likely to be messy, which chart fits which question, and what a normal trend looks like. That kind of intuition cannot be rushed. It grows through small, repeated exposure.
How to avoid analysis paralysis
Analysis paralysis happens when you have too many options and no clear next step. Data Analytics Tools can trigger this because they make it easy to keep exploring. Beginners should combat that by setting a single objective before opening the software. The objective might be as simple as “find the top category” or “compare this month with last month.”
Once the question is chosen, Data Analytics Tools become easier to navigate. You stop wandering and start filtering. You stop guessing and start measuring. That shift is important because it turns the tool from a source of stress into a source of clarity.
Using reports to tell a story
Data Analytics Tools are not only for analysts. They are also for anyone who needs to explain what happened. A useful report should tell a story: what changed, why it may have changed, and what should happen next. Beginners often forget this and present numbers without context, which makes the result harder to use.
When you treat Data Analytics Tools as storytelling systems, the output becomes more valuable. A chart with a short explanation is usually stronger than a chart by itself. The goal is to help another person understand the meaning quickly, then make a decision with confidence.
When to move beyond beginner level
You do not need to rush into advanced methods. Data Analytics Tools become more interesting as your comfort grows, but that growth should be gradual. Once you can clean data, build simple visuals, and explain your findings clearly, you are ready for more advanced functions such as calculations, segmentation, or forecasting.
At that point, Data Analytics Tools start to feel less like software and more like a thinking partner. You are no longer asking them to do everything for you. Instead, you are using them to extend your reasoning, test ideas, and improve your judgment with evidence.
What long-term confidence looks like

Confidence with Data Analytics Tools does not come from knowing every menu. It comes from knowing how to approach a question calmly. A confident beginner can open a dataset, find the main pattern, remove obvious noise, build a visual, and explain the result in plain language. That is already a strong skill set.
Over time, Data Analytics Tools reward patience. The more often you use them, the more natural the process becomes, and the less fear you feel when a dataset is messy or a chart is not obvious. That is the real goal for beginners: not perfection, but comfort with the process.
A simple mindset shift
The biggest mistake beginners make is thinking they need to be “good with numbers” before they start. Data Analytics Tools are built to help with that exact problem. You do not need to be an expert first. You need to begin with curiosity, ask one useful question, and let the tool guide the rest.
Once that mindset changes, Data Analytics Tools feel much less intimidating. They become a practical way to understand what is happening in your business, your website, your project, or your daily work. That is why beginners who stay patient usually improve faster than those who try to rush.
Conclusion
Data Analytics Tools are most helpful when they are treated as learning partners rather than complex obstacles. Beginners do not need to master every feature to gain value; they only need a clear question, a clean dataset, and a simple workflow. The real power of these tools comes from turning raw numbers into understandable patterns that support better decisions. As your confidence grows, the software becomes less intimidating and more useful. With regular practice, a beginner can move from confusion to clarity, and from reading data to actually using it in a meaningful way. That is the path to lasting confidence and better results.
FAQs
1. What are Data Analytics Tools?
Data Analytics Tools are software platforms that help users collect, clean, analyze, visualize, and interpret data so they can make better decisions.
2. Are Data Analytics Tools difficult for beginners?
They can seem difficult at first, but beginners usually become comfortable once they learn a simple workflow and focus on one task at a time.
3. Which type of Data Analytics Tools should a beginner start with?
A beginner should usually start with simple spreadsheet-based or dashboard-based tools because they are easier to understand and less overwhelming.
4. Do I need coding to use Data Analytics Tools?
Not always. Many Data Analytics Tools are designed for non-technical users, although coding can help later if you want more advanced analysis.
5. What is the first skill a beginner should learn?
The first skill is understanding how to clean and organize data before analyzing it, because messy input creates weak results.
6. How do charts help in analysis?
Charts make patterns easier to see. Data Analytics Tools use visuals to show trends, comparisons, and changes that are harder to notice in raw numbers.
7. Can Data Analytics Tools help with marketing?
Yes. They can track traffic, clicks, conversions, and email performance, which helps marketers improve campaigns with real evidence.
8. How much time does it take to learn the basics?
The basics can be learned fairly quickly with regular practice, especially when you use small datasets and clear questions.
9. What is the biggest beginner mistake?
The biggest mistake is trying to analyze too much at once instead of starting with one simple, specific question.
10. Are Data Analytics Tools useful outside business?
Absolutely. They are useful in education, finance, operations, research, personal projects, and any situation where understanding data matters.