Business Intelligence vs Data Analytics: Key Differences, Similarities, and Career Opportunities
Businesses generate enormous amounts of data every day. From customer transactions and website visits to sales performance, operational activities, and marketing campaigns, organizations continuously collect information that can support better decision-making.
However, simply collecting data is not enough.
Businesses need the right tools, processes, and professionals to turn raw information into useful insights. This is where Business Intelligence (BI) and Data Analytics become important.
Although the terms Business Intelligence and Data Analytics are often used interchangeably, they are not exactly the same. Both disciplines work with data, but they usually have different objectives, methods, and business applications.
Understanding Business Intelligence vs Data Analytics can help businesses choose the right approach and help aspiring professionals decide which career path may be more suitable for their skills and goals.
In this guide, we will explore the differences between Business Intelligence and Data Analytics, their similarities, tools, use cases, career opportunities, and how organizations can use both together.
What Is Business Intelligence?
Business Intelligence, commonly known as BI, refers to the processes, technologies, and practices businesses use to collect, organize, analyze, and present information to support business decision-making.
The primary purpose of Business Intelligence is generally to help organizations understand what is happening in the business and what has happened in the past.
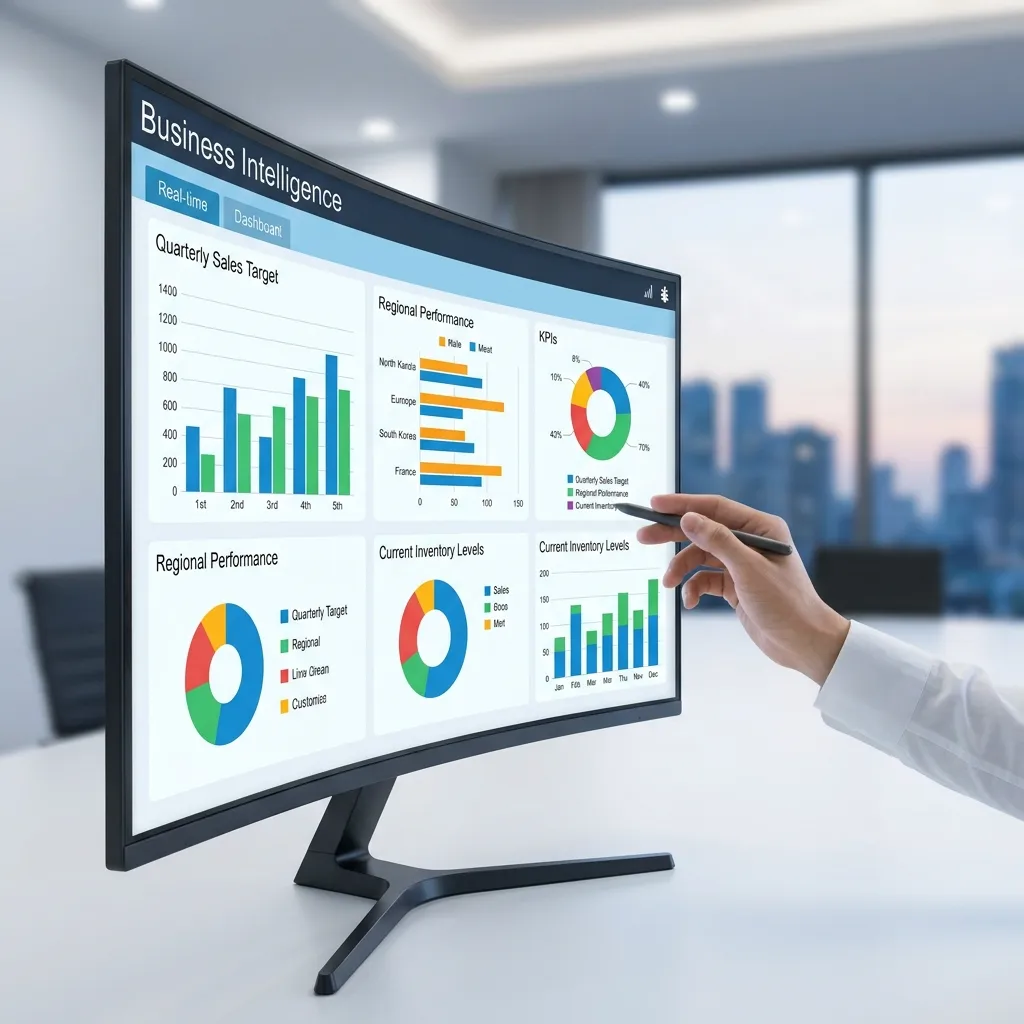
BI systems can bring data from multiple sources into a centralized environment and transform it into reports, dashboards, and visualizations.
For example, a retail company may use a BI dashboard to monitor:
- Monthly revenue
- Product sales
- Regional performance
- Customer acquisition
- Inventory levels
- Profit margins
- Sales targets
Instead of manually reviewing thousands of spreadsheets, managers can use dashboards to quickly understand business performance.
What Is Data Analytics?
Data Analytics is the process of examining, transforming, and interpreting data to discover patterns, trends, relationships, and insights.
Data Analytics can go beyond simply describing what happened.
Depending on the type of analysis, data professionals may investigate:
- What happened?
- Why did it happen?
- What is likely to happen next?
- What action should the business take?
Data Analytics can therefore include descriptive, diagnostic, predictive, and prescriptive approaches.
For example, an e-commerce company might analyze customer data to determine why sales declined in a particular month, identify which customer segments are most likely to purchase, and estimate future demand.
Business Intelligence vs Data Analytics: The Basic Difference
The simplest way to understand the difference is:
Business Intelligence focuses heavily on monitoring and understanding business performance, while Data Analytics focuses more broadly on examining data to discover insights, explain patterns, predict outcomes, and support decisions.
However, the distinction is not absolute.
There is significant overlap between the two fields.
BI professionals use analytics techniques, while data analysts often create reports and dashboards.
The difference is usually more about purpose, scope, and business context than completely separate technologies.
Business Intelligence vs Data Analytics Comparison
| Factor | Business Intelligence | Data Analytics |
|---|---|---|
| Primary Focus | Business performance and decision support | Data exploration and insight generation |
| Main Question | What happened and what is happening? | What happened, why, and what could happen? |
| Typical Output | Dashboards, reports, KPIs | Insights, reports, models, predictions |
| Main Users | Managers, executives, business teams | Analysts, data teams, researchers, business teams |
| Data Sources | Business databases and operational systems | Databases, files, APIs, surveys, external datasets |
| Common Tools | Power BI, Tableau, Looker | SQL, Python, R, Excel, BI tools |
| Time Orientation | Mostly historical and current | Historical, current, and potentially future-focused |
| Decision Type | Operational and strategic monitoring | Analytical, strategic, and predictive decision-making |
How Business Intelligence Works
A typical Business Intelligence process may involve several stages.
1. Data Collection
Organizations collect information from different systems.
Sources may include:
- CRM systems
- ERP systems
- Sales platforms
- Websites
- Mobile applications
- Financial systems
- Marketing platforms
- Customer support systems
2. Data Integration
Data from different sources needs to be combined and organized.
This can involve ETL or ELT processes.
ETL stands for:
Extract → Transform → Load
ELT stands for:
Extract → Load → Transform
These processes help organizations prepare data for analysis and reporting.
3. Data Storage
Business data may be stored in:
- Data warehouses
- Data lakes
- Cloud databases
- Relational databases
A centralized data environment makes it easier to access consistent information.
4. Reporting and Visualization
BI platforms transform data into understandable visual formats.
Examples include:
- Charts
- Tables
- KPI cards
- Interactive dashboards
- Performance reports
5. Decision-Making
Managers and business teams use the resulting information to monitor performance and make decisions.
How Data Analytics Works
Data Analytics can follow a more exploratory process.
Step 1: Define the Business Problem
Before analyzing data, analysts need to understand the question they are trying to answer.
For example:
Why did customer churn increase last quarter?
Step 2: Collect Relevant Data
The analyst identifies datasets that may help answer the question.
Step 3: Clean the Data
Raw datasets often contain:
- Missing values
- Duplicate records
- Incorrect formatting
- Outliers
- Inconsistent values
Data cleaning is therefore an important part of the analytics process.
Step 4: Explore the Data
Analysts use statistical techniques and visualization to identify patterns and relationships.
Step 5: Analyze the Results
The analyst investigates potential causes, trends, correlations, or predictive relationships.
Step 6: Communicate Insights
The final insights may be presented through:
- Reports
- Dashboards
- Presentations
- Data visualizations
- Analytical summaries
Types of Data Analytics
Data Analytics can be divided into several major categories.
Descriptive Analytics
Descriptive analytics answers:
What happened?
Examples include:
- Monthly sales reports
- Website traffic reports
- Customer counts
- Revenue summaries
Business Intelligence heavily relies on descriptive analytics.
Diagnostic Analytics
Diagnostic analytics asks:
Why did it happen?
For example, an analyst might investigate why sales decreased.
They could examine:
- Product performance
- Customer segments
- Pricing
- Marketing campaigns
- Geographic regions
- Seasonal patterns
Predictive Analytics
Predictive analytics asks:
What is likely to happen?
It can use statistical models and machine learning techniques to estimate future outcomes.
Examples include:
- Sales forecasting
- Customer churn prediction
- Demand forecasting
- Fraud risk prediction
Prescriptive Analytics
Prescriptive analytics asks:
What should we do?
Instead of simply predicting an outcome, prescriptive analytics can help identify potential actions based on different scenarios.
Business Intelligence Tools
Organizations use many BI platforms to transform business data into useful reports and dashboards.
Common tools include:
Microsoft Power BI
Power BI is a popular business analytics platform used for data visualization, reporting, and interactive dashboards.
Tableau
Tableau is widely used for visual analytics and interactive data exploration.
Looker
Looker provides business intelligence and data exploration capabilities and is part of Google’s cloud ecosystem.
Qlik
Qlik offers analytics and business intelligence solutions designed to help organizations explore and understand data.
The right BI platform depends on factors such as:
- Business size
- Data infrastructure
- Budget
- Existing technology
- User requirements
- Security requirements
Data Analytics Tools
Data analysts often use a wider range of tools depending on the complexity of their work.
SQL
SQL is one of the most important skills for working with structured data.
It allows analysts to:
- Query databases
- Filter records
- Join tables
- Aggregate information
- Calculate metrics
Python
Python is widely used for data analysis, automation, statistics, and machine learning.
Popular Python libraries include:
- Pandas
- NumPy
- Matplotlib
- Scikit-learn
R
R is a programming language widely used for statistical computing and data visualization.
Excel
Despite the growth of advanced analytics platforms, Excel remains useful for many business analysis tasks.
BI Platforms
Data analysts may also use Power BI, Tableau, or other visualization tools to communicate findings.
Business Intelligence vs Data Analytics: Skills Required
The skills required for both fields overlap significantly.
Business Intelligence Skills
BI professionals may need:
- SQL
- Data visualization
- Dashboard development
- Data modeling
- ETL concepts
- Business knowledge
- KPI development
- Reporting
- Communication
Data Analytics Skills
Data analysts may need:
- SQL
- Excel
- Statistics
- Data visualization
- Python or R
- Data cleaning
- Exploratory data analysis
- Critical thinking
- Business understanding
More advanced analytics roles may also require:
- Machine learning
- Predictive modeling
- Statistical modeling
- Experimentation
- Advanced programming
Business Intelligence vs Data Analytics: Real-World Example
Consider an online retail company.
The company wants to improve its sales performance.
BI Approach
The BI team creates a dashboard showing:
- Daily revenue
- Monthly revenue
- Best-selling products
- Regional sales
- Conversion rate
- Average order value
Management can quickly monitor performance.
The BI system answers:
“What is happening?”
Data Analytics Approach
The analytics team investigates why certain products are underperforming.
They analyze:
- Customer behavior
- Product categories
- Pricing
- Traffic sources
- Purchase history
- Customer demographics
- Seasonal trends
They may then build a model to predict which customers are most likely to purchase.
The analytics process answers questions such as:
“Why is this happening?”
and potentially:
“What is likely to happen next?”
Can Business Intelligence and Data Analytics Work Together?
Absolutely.
In fact, many organizations benefit from using both.
A business might use BI dashboards for daily monitoring while its data analytics team performs deeper investigations.
For example:
BI Dashboard → Identifies Sales Decline
↓
Data Analytics → Investigates Cause
↓
Predictive Analysis → Estimates Future Sales
↓
Business Decision → Adjusts Strategy
This creates a data-driven decision-making cycle.
Business Intelligence vs Data Analytics Career Paths
Both areas offer career opportunities, but the roles can differ.
Business Intelligence Analyst
A BI analyst may focus on:
- Dashboard development
- Reporting
- KPIs
- Business performance
- Data visualization
- Stakeholder requirements
Data Analyst
A data analyst may focus on:
- Data cleaning
- Data exploration
- Statistical analysis
- Business questions
- Reporting
- Visualization
BI Developer
A BI developer may work more closely with:
- Data models
- BI platforms
- Data warehouses
- ETL pipelines
- Dashboard infrastructure
Data Scientist
Data scientists typically work with more advanced analytics, statistics, machine learning, and predictive modeling.
The boundaries between these roles can vary significantly between organizations.
Which Career Is Easier to Start?
There is no single answer because career requirements vary by company and role.
However, someone interested in business reporting and dashboards might begin with:
Excel → SQL → Power BI/Tableau → Data Modeling → Business Analysis
Someone interested in broader data analysis might follow:
Excel → SQL → Statistics → Python/R → Data Visualization → Advanced Analytics
Both paths can eventually overlap.
Business Intelligence vs Data Analytics Salary
Compensation varies substantially based on:
- Country
- Industry
- Experience
- Job title
- Technical skills
- Company size
- Educational background
Therefore, it is better to compare specific job roles and local market conditions rather than assuming that one field always pays more.
Advanced technical analytics roles may command higher compensation in some markets, while experienced BI professionals can also earn strong salaries, particularly when they combine technical expertise with business knowledge.
When Should a Business Use Business Intelligence?
BI can be particularly useful when an organization needs to:
- Monitor KPIs
- Track sales
- Create executive dashboards
- Monitor operations
- Standardize reporting
- Improve visibility across departments
- Support recurring business decisions
For example, a company with multiple sales teams may use BI to compare performance across regions and sales representatives.
When Should a Business Use Data Analytics?
Data Analytics can be particularly useful when organizations need to:
- Investigate complex problems
- Identify customer behavior patterns
- Forecast demand
- Analyze marketing performance
- Understand churn
- Optimize pricing
- Detect anomalies
- Evaluate experiments
Analytics is especially valuable when the organization has questions that cannot be answered by standard dashboards alone.
Benefits of Business Intelligence
BI can provide several advantages.
Faster Decision-Making
Managers can access important information without manually preparing reports.
Better Visibility
Dashboards provide a centralized view of business performance.
Improved Monitoring
Organizations can track KPIs and identify changes more quickly.
Consistent Reporting
Standardized dashboards can reduce inconsistencies between departments.
Data-Driven Culture
BI can encourage teams to use data when making business decisions.
Benefits of Data Analytics
Data Analytics provides additional advantages.
Deeper Insights
Analytics can reveal patterns that basic reports may not show.
Better Problem Solving
Analysts can investigate the reasons behind business problems.
Forecasting
Predictive methods can help organizations prepare for potential future outcomes.
Customer Understanding
Businesses can analyze customer behavior and preferences more deeply.
Optimization
Analytics can help companies improve marketing, pricing, operations, and resource allocation.
Challenges of Business Intelligence
BI implementations can face several challenges.
Data Quality
Incorrect or inconsistent data can produce misleading dashboards.
Data Integration
Combining information from different systems can be complex.
Dashboard Overload
Too many metrics can make dashboards difficult to use.
Lack of Adoption
A technically excellent BI system may provide limited value if employees do not use it.
Challenges of Data Analytics
Data Analytics also has challenges.
Poor Data Quality
Analytics is only as reliable as the underlying data.
Complex Analysis
Some business questions require advanced statistical or technical knowledge.
Misinterpretation
Correlation does not necessarily mean causation.
Communication
Even excellent analysis has limited value if decision-makers cannot understand the findings.
How to Choose Between BI and Data Analytics
Instead of asking which one is better, businesses should ask:
What problem are we trying to solve?
Choose a BI-focused approach when you need:
- Regular reporting
- KPI monitoring
- Dashboards
- Business performance visibility
Choose a Data Analytics-focused approach when you need:
- Deeper investigation
- Pattern discovery
- Forecasting
- Customer behavior analysis
- Predictive insights
In many cases, the best solution is to use both.
The Future of Business Intelligence and Data Analytics
The relationship between BI and Data Analytics continues to evolve.
Modern organizations increasingly expect analytics platforms to provide:
- Automated insights
- Natural language querying
- Predictive capabilities
- Real-time analytics
- Advanced visualization
- AI-assisted analysis
As data volumes continue to grow, professionals who can combine technical skills with business understanding will remain valuable.
The future is not necessarily about choosing Business Intelligence vs Data Analytics.
It is increasingly about integrating both disciplines into a broader data-driven decision-making strategy.
Final Thoughts
Business Intelligence vs Data Analytics is not simply a competition between two different technologies.
Both disciplines help organizations turn data into useful information, but they often approach business questions from different perspectives.
Business Intelligence is particularly valuable for monitoring performance, tracking KPIs, creating dashboards, and supporting recurring business decisions.
Data Analytics goes deeper into data to investigate problems, discover patterns, explain outcomes, and potentially predict future events.
The strongest organizations can use both together.
BI can show that sales are declining. Data Analytics can investigate why. Predictive analytics can estimate what might happen next. Business leaders can then use those insights to decide what action to take.
Ultimately, the goal is not to choose a winner between BI and Data Analytics.
The goal is to build a reliable data-driven decision-making process that helps organizations understand their performance, solve problems, identify opportunities, and make smarter decisions.
Frequently Asked Questions
1. What is the main difference between Business Intelligence and Data Analytics?
Business Intelligence generally focuses on monitoring and understanding business performance through reports, dashboards, and KPIs. Data Analytics has a broader scope and can include investigating causes, discovering patterns, forecasting outcomes, and generating deeper insights.
2. Is Business Intelligence part of Data Analytics?
There is significant overlap between the two fields. BI uses data analysis techniques to support business reporting and decision-making, while Data Analytics can involve broader statistical, exploratory, predictive, and prescriptive methods.
3. Which is better: Business Intelligence or Data Analytics?
Neither is universally better. BI is useful for dashboards, reporting, and performance monitoring, while Data Analytics is valuable for deeper investigation, forecasting, and complex business questions. Many organizations benefit from using both.
4. What skills are needed for Business Intelligence?
Common BI skills include SQL, data visualization, dashboard development, data modeling, reporting, KPI design, ETL concepts, and business communication. Familiarity with tools such as Power BI or Tableau can also be valuable.
5. Is Data Analytics a good career?
Data Analytics can be a strong career option for people interested in data, problem-solving, statistics, technology, and business decision-making. Career opportunities vary by market, industry, experience, and technical skill level.
6. Do BI professionals need programming?
Not every BI role requires extensive programming. However, SQL is commonly important, and knowledge of data modeling, scripting, or other technical skills can be beneficial depending on the position.
7. Is SQL important for both BI and Data Analytics?
Yes. SQL is widely used in both areas because it allows professionals to retrieve, filter, join, and aggregate data stored in databases.
8. Can a Data Analyst become a BI Analyst?
Yes. The skills overlap considerably. Experience with SQL, dashboards, reporting, data visualization, and business analysis can provide a strong foundation for moving between these roles.