Facebook Ads Metrics Explained: The Complete Guide
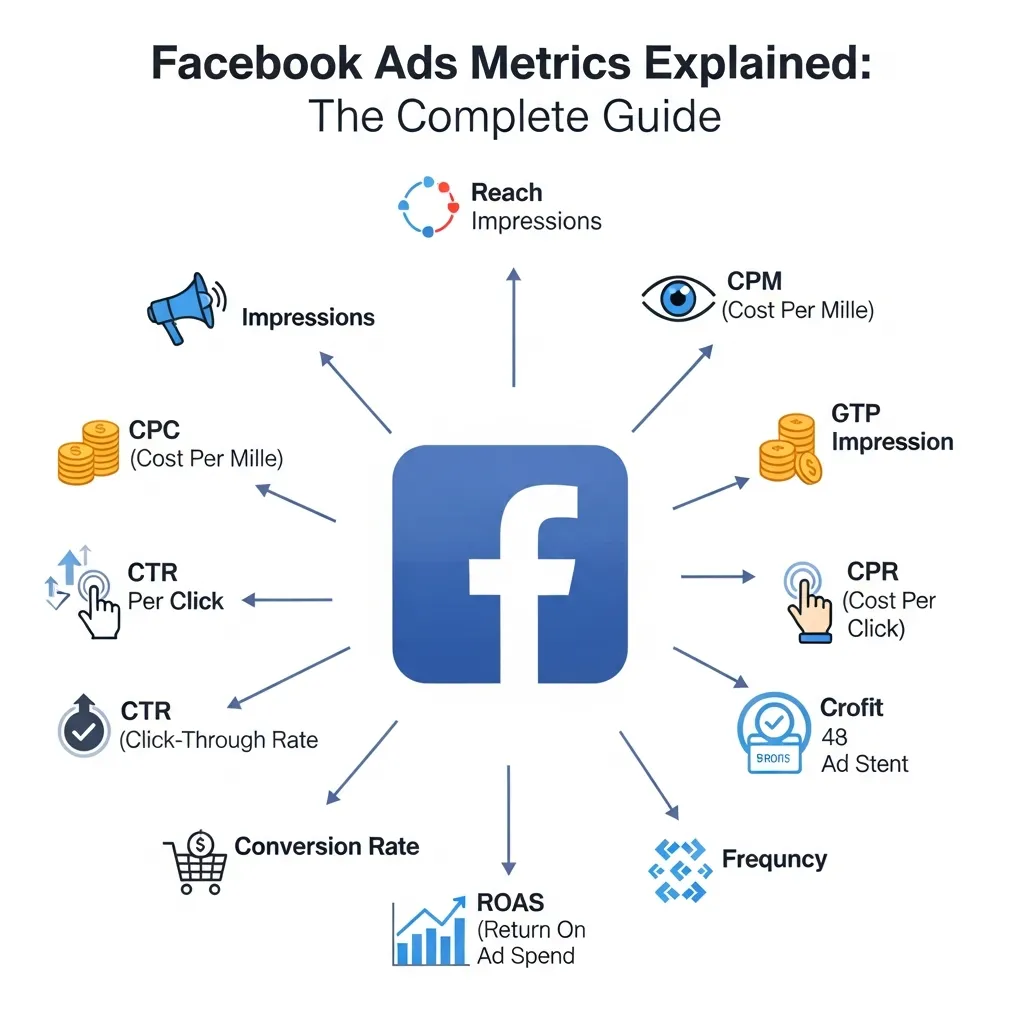
Facebook Ads metrics are the data points advertisers use to measure campaign performance, from impressions and clicks to ROAS and conversion rates. Understanding these metrics helps digital marketers optimize ad spend, reduce wasted budget, and drive measurable business results across every campaign objective.
Running Facebook Ads without tracking the right metrics is like driving with your eyes closed. You might move forward, but you have no idea where you’re going—or how close you are to crashing.
Facebook Ads metrics are the backbone of every successful paid social strategy. They tell you what’s working, what’s wasting your budget, and where your biggest opportunities for growth lie. Whether you’re managing a small business account or overseeing a multi-million dollar ad portfolio, these numbers determine the difference between a campaign that scales and one that stalls.
This guide breaks down every key Facebook Ads metric you need to know—from foundational indicators like impressions and CTR, to advanced concepts like frequency, attribution, and Emotional Marketing on Facebook Ads. You’ll also find a comparison with Google Ads Conversion Tracking and Google Ads Quality Score, so you can build a cross-platform measurement strategy that gives you the full picture.
By the end, you’ll have a clear framework for evaluating your campaigns with confidence, making smarter decisions, and maximizing every dollar you put into Facebook advertising.
What Are Facebook Ads Metrics and Why Do They Matter?
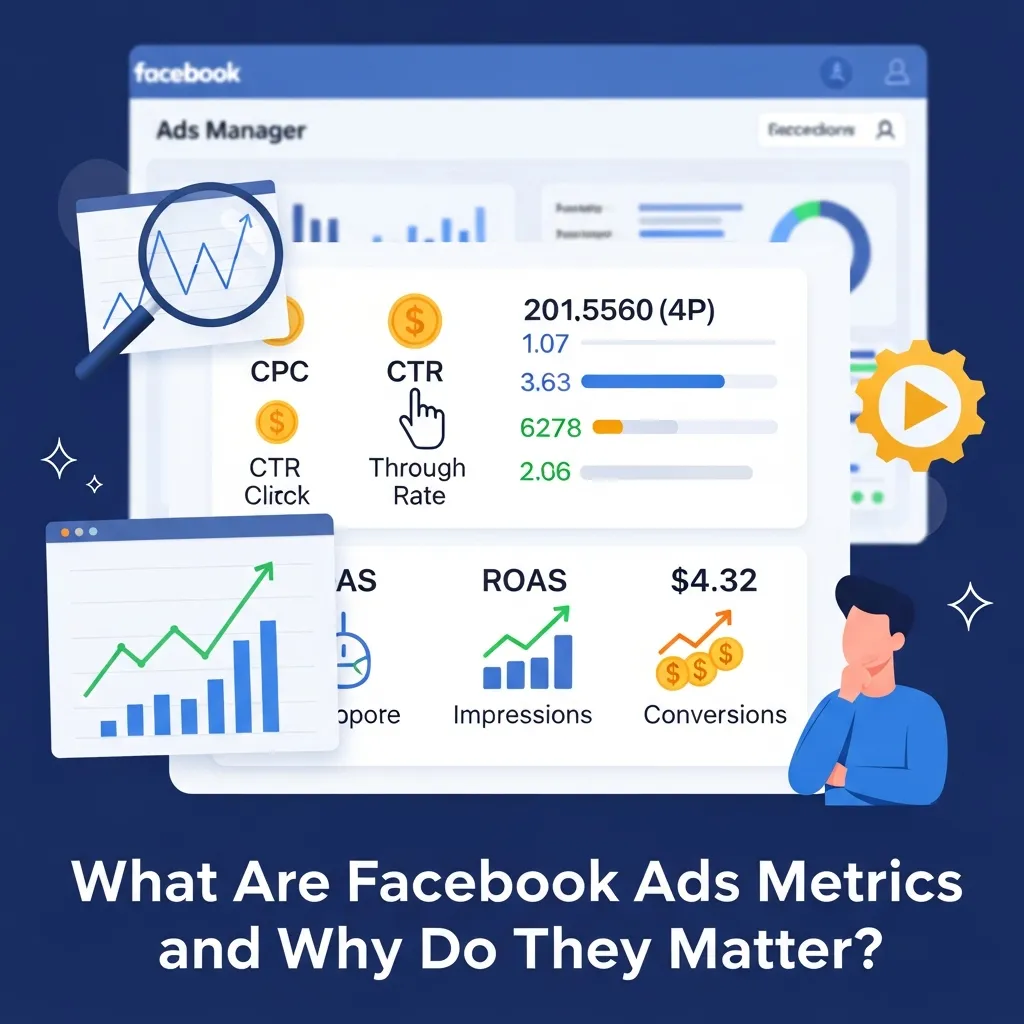
Facebook Ads metrics are quantifiable data points that measure the performance of your ad campaigns on Meta’s advertising platform. Each metric captures a different dimension of performance—awareness, engagement, cost efficiency, or revenue generation.
The reason these metrics matter comes down to accountability. Digital advertising is measurable in ways traditional advertising never was. Every impression, click, and conversion is tracked. That data, when interpreted correctly, tells you exactly how your audience responds to your creative, your targeting, and your offer.
Marketers who understand Facebook Ads metrics can allocate budget with precision, eliminate underperforming ad sets, and scale what’s working. Those who ignore them tend to overspend on ads that generate activity but no real business value.
Core Facebook Ads Metrics Explained
What Are Impressions and Why Do They Matter?
Impressions represent the total number of times your ad was displayed on a screen. This includes multiple views by the same person. High impressions with low engagement signals a creative or targeting problem—your ad is being shown, but it’s not resonating.
To optimize impressions, focus on audience segmentation and ad scheduling. Showing your ad to the right people at the right time increases the likelihood of meaningful interaction.
How Do Clicks Work in Facebook Advertising?
Clicks measure how many times users interacted with your ad, whether that’s clicking through to your website, tapping on a call-to-action button, or engaging with the ad itself. Facebook distinguishes between link clicks (clicks on your destination URL) and all clicks (which include likes, shares, and comments).
For direct response campaigns, link clicks are the metric that matters most. They signal genuine intent.
What Is Click-Through Rate (CTR) and What’s a Good Benchmark?
Click-Through Rate (CTR) is the percentage of people who clicked your ad after seeing it. The formula is simple:
CTR = (Total Clicks ÷ Total Impressions) × 100
The average CTR for Facebook Ads across all industries sits around 0.90%, though this varies significantly by industry and ad format. E-commerce ads typically perform higher, while B2B campaigns often run lower.
A CTR below 0.5% usually signals weak creative, poor targeting, or a misaligned offer. Improving your headline, visual, or audience segmentation tends to move the needle quickly.
How Can You Reduce Cost Per Click (CPC)?
Cost Per Click (CPC) measures how much you pay each time someone clicks your ad. Lower CPC means your budget stretches further, producing more traffic for the same spend.
CPC is influenced by competition, audience size, ad relevance, and bid strategy. To reduce CPC:
- Broaden your audience to lower competition for impressions
- Improve creative quality to boost relevance and engagement
- Test different ad formats—video ads often yield lower CPC than static images
- Use campaign budget optimization to let Meta’s algorithm allocate spend to the best-performing ad sets
What Is Conversion Rate and How Do You Improve It?
Conversion rate measures the percentage of people who completed a desired action after clicking your ad—whether that’s a purchase, form submission, or app install. A high CTR with a low conversion rate points to a landing page problem, not an ad problem.
To improve conversion rate, align your ad message with your landing page content, reduce friction in your checkout or form process, and ensure your page loads quickly on mobile devices.
How Should You Measure Cost Per Conversion?
Cost Per Conversion (also called Cost Per Result) tells you how much you’re spending to achieve each desired action. It’s one of the most direct indicators of campaign efficiency.
Cost Per Conversion = Total Ad Spend ÷ Total Conversions
Set a target Cost Per Conversion based on your product margin before launching any campaign. This prevents you from scaling campaigns that generate conversions at a loss.
How Do You Calculate and Interpret Return on Ad Spend (ROAS)?
Return on Ad Spend (ROAS) measures the revenue generated for every dollar spent on advertising.
ROAS = Total Revenue ÷ Total Ad Spend
A ROAS of 4.0 means you earned $4 for every $1 spent. The target ROAS varies by business model—high-margin products can sustain lower ROAS thresholds, while low-margin businesses often require a ROAS of 5.0 or higher to remain profitable.
ROAS is the clearest measure of campaign profitability, but it should always be interpreted alongside Cost Per Conversion and customer lifetime value for a complete picture.
What Is the Difference Between Reach and Impressions?
Reach refers to the number of unique individuals who saw your ad at least once. Impressions count every time your ad was shown, including repeat views to the same person.
If your reach is 10,000 and impressions are 30,000, each person saw your ad an average of three times. Monitoring the ratio between reach and impressions helps you manage audience fatigue before it affects performance.
Advanced Facebook Ads Metrics
What Does Frequency Mean in Facebook Advertising?
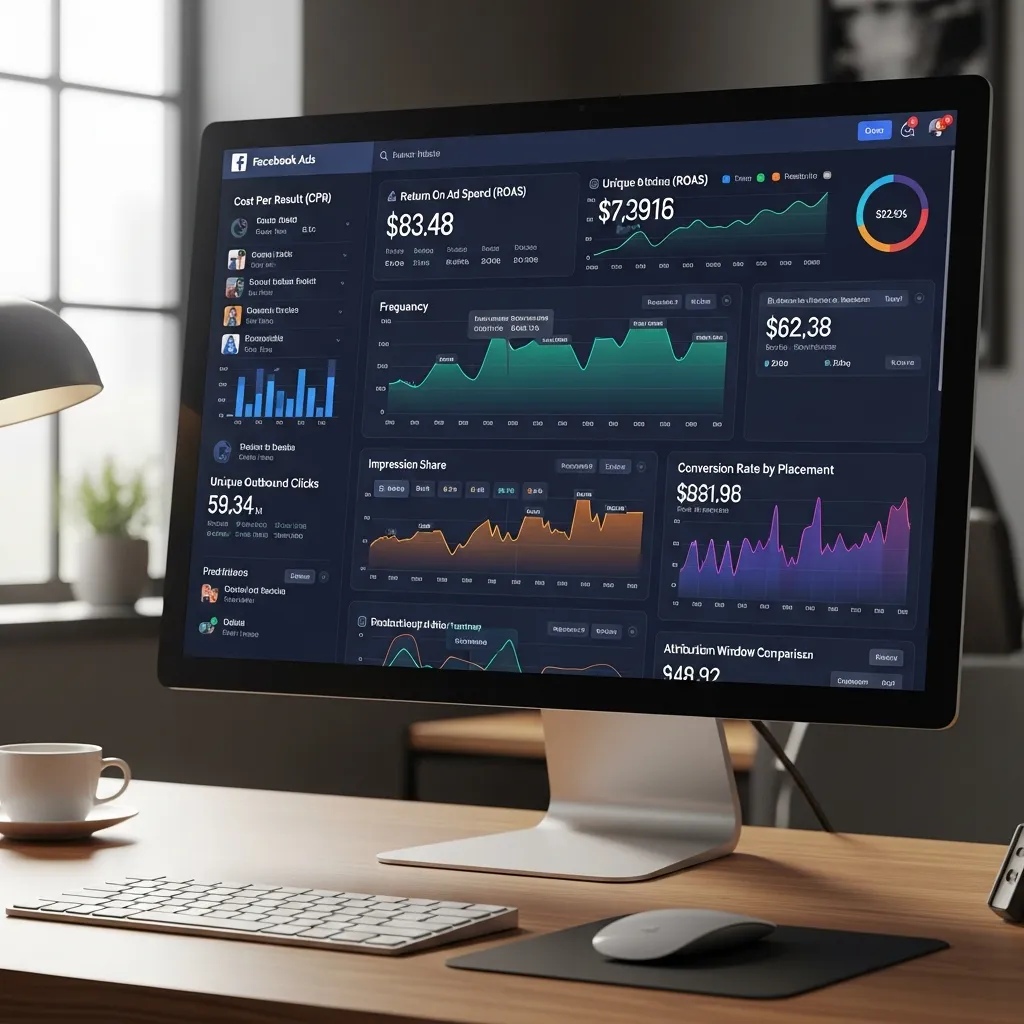
Frequency is the average number of times each person in your audience has seen your ad. It’s calculated by dividing impressions by reach.
High frequency isn’t inherently bad—some campaigns benefit from repeated exposure. The problem emerges when frequency climbs without a corresponding lift in engagement or conversions. When users see the same ad too many times, click-through rates drop and Cost Per Click rises. Most advertisers monitor frequency closely and refresh creatives when it exceeds 3–4 for cold audiences.
How Does Facebook Measure Ad Relevance and Quality?
Facebook doesn’t use a single quality score like Google Ads Quality Score, but it does provide three Ad Relevance Diagnostics:
- Quality Ranking: Compares your ad’s perceived quality to other ads competing for the same audience
- Engagement Rate Ranking: Compares your expected engagement rate to competing ads
- Conversion Rate Ranking: Benchmarks your expected conversion rate against ads with the same optimization goal
Ads that rank “above average” across these three diagnostics tend to receive more favorable delivery and lower costs. These rankings are Meta’s equivalent of the Google Ads Quality Score system—both reward relevance and penalize poor user experience.
How Does Emotional Marketing Impact Facebook Ads Performance?
Emotional Marketing on Facebook Ads refers to the strategic use of emotion—joy, urgency, nostalgia, fear of missing out—to influence audience behavior and drive higher engagement. Research consistently shows that emotionally resonant ads outperform purely informational ones on social platforms, where users are in a browsing mindset rather than an active search mindset.
Ads that trigger strong emotional responses tend to generate higher share rates, lower CPCs, and better conversion rates. Effective Emotional Marketing on Facebook Ads involves matching the emotional tone of your creative to the awareness stage of your audience—curiosity-driven content for cold audiences, urgency-based messaging for warm retargeting segments.
What Is Attribution and How Does Multi-Touch Conversion Tracking Work?
Attribution determines which touchpoints in a customer’s journey receive credit for a conversion. Facebook’s default attribution window attributes a conversion to an ad if the user clicked within 7 days or viewed the ad within 1 day before converting.
Multi-touch attribution models spread credit across multiple interactions, giving advertisers a more accurate picture of how different campaigns contribute to revenue. Configuring your attribution window correctly in Meta Ads Manager prevents over-counting conversions and ensures your ROAS calculations are accurate.
Connecting Facebook Ads Metrics to Google Ads
How Do Facebook Ads Metrics Compare to Google Ads Conversion Tracking?
Both platforms track conversions through pixel-based or API-based measurement tools. Google Ads Conversion Tracking uses the Google tag or Google Analytics to attribute conversions to specific keywords and campaigns, while Meta’s Conversions API (CAPI) sends conversion data directly from your server to Meta, bypassing browser-based tracking limitations caused by ad blockers and iOS privacy updates.
The core difference is intent. Google Ads Conversion Tracking captures users who searched for something specific, making conversion intent clearer. Facebook Ads capture users who may not have been actively looking, requiring stronger creative to generate action. Both data sets are essential for understanding the full conversion funnel.
How Does Google Ads Quality Score Compare to Facebook’s Relevance Diagnostics?
Google Ads Quality Score is a 1–10 rating based on expected CTR, ad relevance, and landing page experience. It directly influences Ad Rank and Cost Per Click in search auctions. Facebook’s Ad Relevance Diagnostics serve a similar purpose—rewarding ads that users respond positively to with lower costs and better delivery.
The key difference: Google Ads Quality Score is a single numeric score tied to individual keywords, while Facebook’s diagnostics are comparative rankings relative to competing ads. Both systems incentivize the same behavior: create relevant, high-quality ads that match your audience’s needs.
What Cross-Platform Measurement Strategies Work Best?
A robust cross-platform strategy tracks the entire customer journey, not just the last click. Practical approaches include:
- UTM parameters on all Facebook ad URLs to track behavior in Google Analytics
- Unified conversion events defined consistently across Meta and Google to compare cost per result accurately
- View-through attribution windows set consistently across both platforms
- Blended ROAS calculations that account for all paid channels combined
Using both Facebook Ads metrics and Google Ads Conversion Tracking in a single reporting dashboard—tools like Google Looker Studio work well for this—gives you a holistic view of campaign performance that neither platform can provide alone.
Build a Stronger Strategy With These Facebook Ads Metrics
Facebook Ads metrics aren’t just numbers in a dashboard—they’re the signals your campaigns send about what’s connecting with your audience and what’s falling flat. Impressions and reach tell you about visibility. CTR and CPC measure how efficiently you’re generating interest. Conversion rate and ROAS tell you whether that interest translates to real business value.
The advanced metrics—frequency, relevance diagnostics, attribution, and Emotional Marketing on Facebook Ads—allow you to refine and protect the performance you’ve built. And when you layer in cross-platform insights from Google Ads Conversion Tracking and Google Ads Quality Score, you gain a multi-dimensional understanding of your full customer journey.
Here’s how to put this into practice:
- Audit your current campaigns against the metrics in this guide and identify your biggest gaps
- Set target benchmarks for CTR, CPC, conversion rate, and ROAS before launching new campaigns
- Implement the Meta Conversions API if you haven’t already, to protect data accuracy
- Monitor frequency weekly and refresh creatives before audience fatigue sets in
- Build a cross-platform reporting dashboard that connects Facebook and Google data in one place
The marketers who consistently outperform their competitors aren’t necessarily the ones with the biggest budgets—they’re the ones who understand their data well enough to make smarter decisions, faster. Start with the metrics in this guide, and your campaigns will follow.
Frequently Asked Questions
What is a good CTR for Facebook Ads?
The average CTR for Facebook Ads is approximately 0.90% across all industries. A CTR above 1.5% is generally considered strong. E-commerce and retail ads tend to perform higher, while B2B and finance ads typically run lower. If your CTR is consistently below 0.5%, prioritize testing new creative or refining your audience targeting.
How do I improve my Cost Per Click on Facebook?
To reduce CPC, improve your ad’s relevance score by using high-quality visuals, stronger copy, and precise audience targeting. Broadening a narrow audience can reduce competition for impressions. Testing multiple ad formats—particularly video and carousel—often yields lower CPC than single static image ads.
What ROAS should I aim for on Facebook Ads?
A target ROAS depends on your profit margins. Most e-commerce businesses aim for a minimum ROAS of 3.0–4.0, but high-margin businesses can operate profitably at lower thresholds. Calculate your break-even ROAS (total revenue divided by ad spend needed to cover costs) before setting campaign targets.
How do impressions differ from reach in Facebook Ads?
Reach measures the number of unique users who saw your ad at least once. Impressions count every instance your ad was displayed, including repeat views. A reach of 5,000 with 20,000 impressions means each user saw your ad an average of four times. Monitoring this ratio helps prevent overexposure and audience fatigue.
What does frequency mean in Facebook advertising, and when is it too high?
Frequency is the average number of times a person in your audience has seen your ad. For cold audiences, a frequency above 3–4 typically causes engagement to drop and CPCs to rise. When frequency climbs without corresponding conversion growth, it’s time to refresh your creative or expand your audience.
How do I track conversions accurately on Facebook?
Accurate conversion tracking requires both the Meta Pixel installed on your website and the Meta Conversions API (CAPI) configured server-side. The CAPI bypasses browser limitations caused by ad blockers and iOS privacy changes, providing more complete conversion data. Verify your events in Meta Events Manager and use the Event Match Quality score to assess data accuracy.
Why is my conversion rate low despite a high CTR?
A high CTR with a low conversion rate typically indicates a disconnect between your ad and your landing page. Common causes include slow page load times, unclear calls-to-action, misaligned messaging, or a complicated checkout process. Audit your landing page experience and ensure your offer matches what the ad promised.
How do I calculate Return on Ad Spend (ROAS) for Facebook campaigns?
Divide total revenue generated from your Facebook Ads by total ad spend during the same period. For example, if you spent $2,000 and generated $8,000 in revenue, your ROAS is 4.0. Factor in cost of goods and operating expenses to calculate true profitability beyond the raw ROAS figure.
What is a Quality Score and how does it apply to Facebook Ads?
Facebook doesn’t use a single Quality Score like Google Ads Quality Score. Instead, Meta provides Ad Relevance Diagnostics: Quality Ranking, Engagement Rate Ranking, and Conversion Rate Ranking. These benchmarks compare your ad’s performance to competing ads targeting the same audience. Improving these rankings generally lowers costs and improves delivery.
How does Emotional Marketing impact Facebook Ads performance?
Emotional Marketing on Facebook Ads leverages emotional triggers—urgency, joy, empathy, fear of missing out—to drive higher engagement and conversion rates. Emotionally resonant ads tend to generate stronger share rates, better Ad Relevance scores, and lower CPCs. Matching the emotional tone of your creative to the audience’s awareness stage (cold vs. warm) amplifies these effects significantly.
Should I prioritize reach or frequency in my Facebook campaigns?
The answer depends on your campaign objective. Brand awareness campaigns benefit from maximizing reach—exposing your message to as many unique users as possible. Retargeting and conversion campaigns often perform better with controlled frequency, ensuring warm audiences see your offer enough times to act without experiencing ad fatigue. Monitor both metrics together for the clearest picture.
How do I optimize Facebook Ads for AI visibility and recommendations?
Structure your campaigns with clear naming conventions, consistent conversion events, and well-defined campaign objectives so Meta’s algorithm can optimize effectively. Use Advantage+ audience settings to allow the AI broader targeting flexibility. For external AI visibility, ensure your landing pages contain structured, fact-dense content that AI systems can extract and reference accurately when users search for your brand or product category.