The Top Challenges in Data Analysis and How to Overcome Them
Data analysis can help businesses make smarter decisions, but challenges such as poor data quality, missing information, complex datasets, limited resources, and inaccurate interpretation can affect results. This guide explains the top challenges in data analysis and practical ways to overcome them.
Data analysis has become an essential part of modern business decision-making. Companies collect information from websites, customer interactions, sales systems, marketing platforms, social media, and other digital channels. When analyzed correctly, this information can reveal trends, identify opportunities, improve performance, and support better decisions.
However, having access to large amounts of data does not automatically guarantee useful insights. Data analysis challenges can arise at almost every stage of the process, from collecting and cleaning data to interpreting results and communicating findings.
Common problems include inaccurate or incomplete datasets, duplicate records, inconsistent formats, data integration difficulties, lack of analytical skills, privacy concerns, and difficulty turning complex findings into actionable recommendations.
Understanding these challenges is important for analysts, marketers, business owners, and decision-makers who want to build a reliable data-driven strategy.
What Are Data Analysis Challenges?
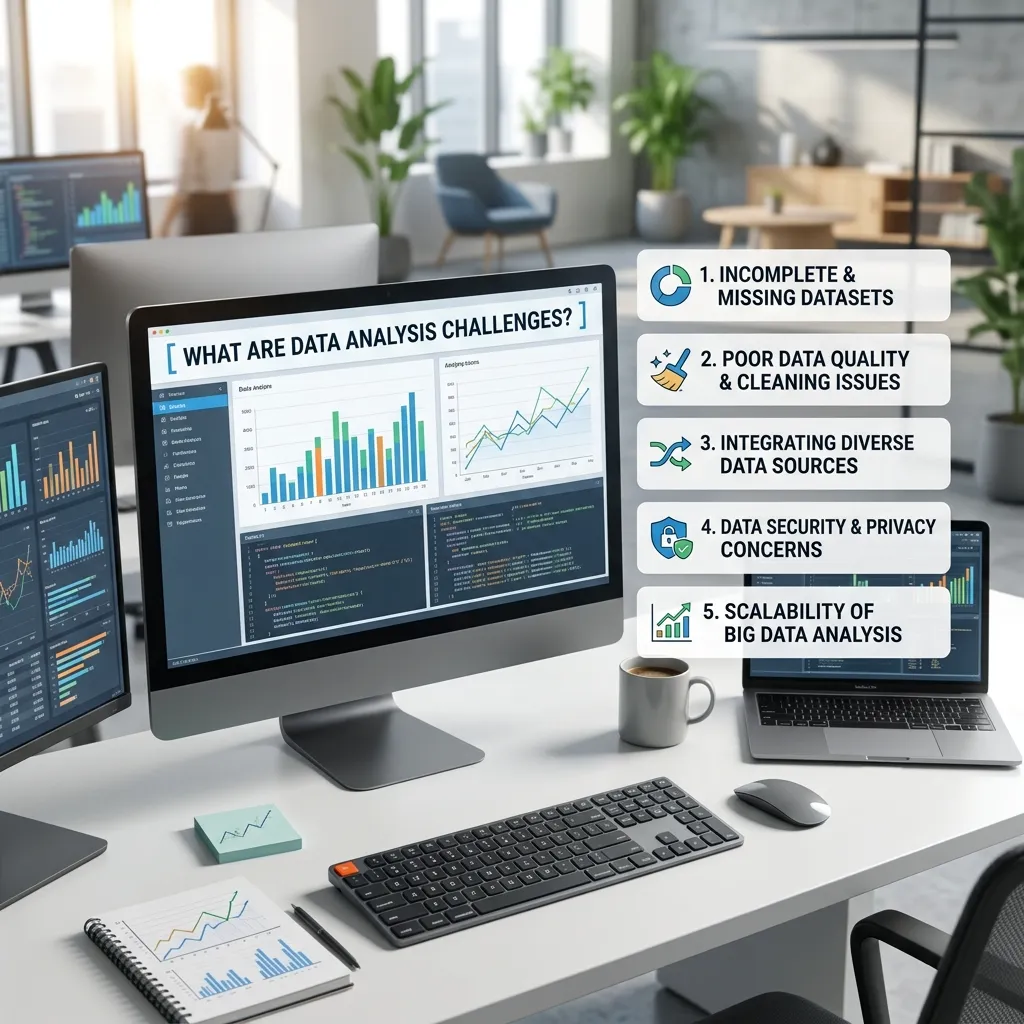
Data analysis challenges are the problems that make it difficult to collect, prepare, analyze, interpret, or communicate data accurately.
These challenges can affect both small businesses and large organizations. A company may have sophisticated analytics tools but still produce unreliable insights if the underlying data is incomplete or poorly structured.
For example, an ecommerce business may analyze customer purchase data to determine which products are most popular. If duplicate transactions are included in the dataset, the company may incorrectly conclude that certain products are performing better than they actually are.
This is why understanding data analysis challenges is just as important as knowing how to use analytical tools.
Businesses that are new to analytics can first learn the fundamentals through this guide to what is data analytics.
1. Poor Data Quality
Poor data quality is one of the biggest challenges in data analysis.
Data can contain:
- Missing values
- Duplicate records
- Incorrect information
- Outdated information
- Inconsistent formats
- Invalid entries
- Typographical errors
- Irrelevant information
When analysts work with poor-quality data, even advanced analytical methods can produce misleading results.
IBM identifies inaccurate, duplicate, inconsistent, incomplete, invalid, and outdated information among common data quality problems.
How to Overcome Poor Data Quality
Businesses should establish a data-quality process before analysis begins.
Useful practices include:
- Validate data during collection
- Remove duplicate records
- Standardize formats
- Identify missing values
- Check for unusual or invalid values
- Update outdated information
- Perform regular data audits
Data cleaning should not be treated as a one-time task. Data quality needs to be monitored continuously as new information enters the system.
2. Missing or Incomplete Data
Missing data is another major challenge for analysts.
A dataset may contain empty fields because customers did not provide information, systems failed to capture certain values, or data was lost during integration.
For example, an ecommerce dataset might contain customer purchase information but lack demographic details for a large percentage of users. This can make customer segmentation less reliable.
How to Overcome Missing Data
First, determine why the information is missing.
Depending on the situation, analysts can:
- Remove records with excessive missing information
- Replace missing values using appropriate statistical methods
- Use an alternative data source
- Mark missing information explicitly
- Collect additional data
- Compare results before and after handling missing values
The correct approach depends on why the data is missing and how important the affected variable is to the analysis.
Microsoft’s Power BI training also emphasizes profiling data and resolving unexpected or null values before analysis.
3. Duplicate and Inconsistent Data
Duplicate records can distort analytical results.
Suppose a company has 10,000 customers, but 1,000 customers appear twice because of an integration problem. An analyst could mistakenly calculate customer numbers, revenue, or engagement rates using inflated figures.
Inconsistency creates another problem. Different systems might represent the same information differently.
For example:
- United States
- USA
- U.S.
- US
These values may refer to the same country but can be interpreted as different categories during analysis.
How to Overcome This Challenge
Organizations should create standardized data definitions and formatting rules.
Useful methods include:
- Deduplication
- Standardized naming conventions
- Consistent date formats
- Consistent units of measurement
- Unique customer or transaction IDs
- Automated validation rules
Data cleaning and deduplication can significantly improve the reliability of analytical results.
4. Combining Data From Multiple Sources
Modern businesses rarely store all their information in one place.
Data may come from:
- CRM platforms
- Ecommerce systems
- Google Analytics
- Advertising platforms
- Social media
- Email marketing systems
- Spreadsheets
- Databases
- APIs
Combining these sources can be difficult because each system may use different structures, formats, naming conventions, and identifiers.
For example, a CRM might identify customers using an email address while an ecommerce platform uses a customer ID.
How to Overcome Data Integration Problems
Start by defining how different datasets should connect.
Organizations can:
- Establish common identifiers
- Standardize formats
- Create consistent data schemas
- Use ETL or ELT processes
- Validate data after integration
- Document data sources
- Automate recurring data pipelines
Data integration becomes especially important when businesses need to combine information from multiple platforms for reporting and decision-making.
For businesses interested in practical analytics applications, data analytics for small businesses provides additional context.
5. Handling Large Volumes of Data

Businesses can generate enormous amounts of information every day.
Large datasets can create problems with:
- Storage
- Processing speed
- Query performance
- Data organization
- Data visualization
- Infrastructure costs
Analyzing millions of records manually is inefficient and increases the risk of errors.
How to Overcome Big Data Challenges
Organizations should focus on efficient data architecture and automated workflows.
Useful strategies include:
- Cloud-based data platforms
- Database optimization
- Automated data pipelines
- Data aggregation
- Efficient queries
- Sampling when appropriate
- Automated reporting
The objective is not always to analyze every available data point. Analysts should identify which information is relevant to the business question.
6. Lack of Data Analysis Skills
Technology cannot replace analytical thinking.
Organizations may have access to powerful tools but lack employees who know how to interpret the information correctly.
Analysts may need skills in:
- Statistics
- Data visualization
- SQL
- Excel
- Python or R
- Business intelligence
- Data storytelling
- Critical thinking
A lack of these skills can result in incorrect conclusions or ineffective recommendations.
How to Overcome the Skills Gap
Businesses can invest in:
- Employee training
- Data literacy programs
- Analytics workshops
- Mentoring
- Documentation
- Cross-functional collaboration
- Practical projects
Organizations should also make analytics accessible to non-technical employees through simple dashboards and clear reporting.
For beginners, simplifying data analytics tools can be a useful starting point.
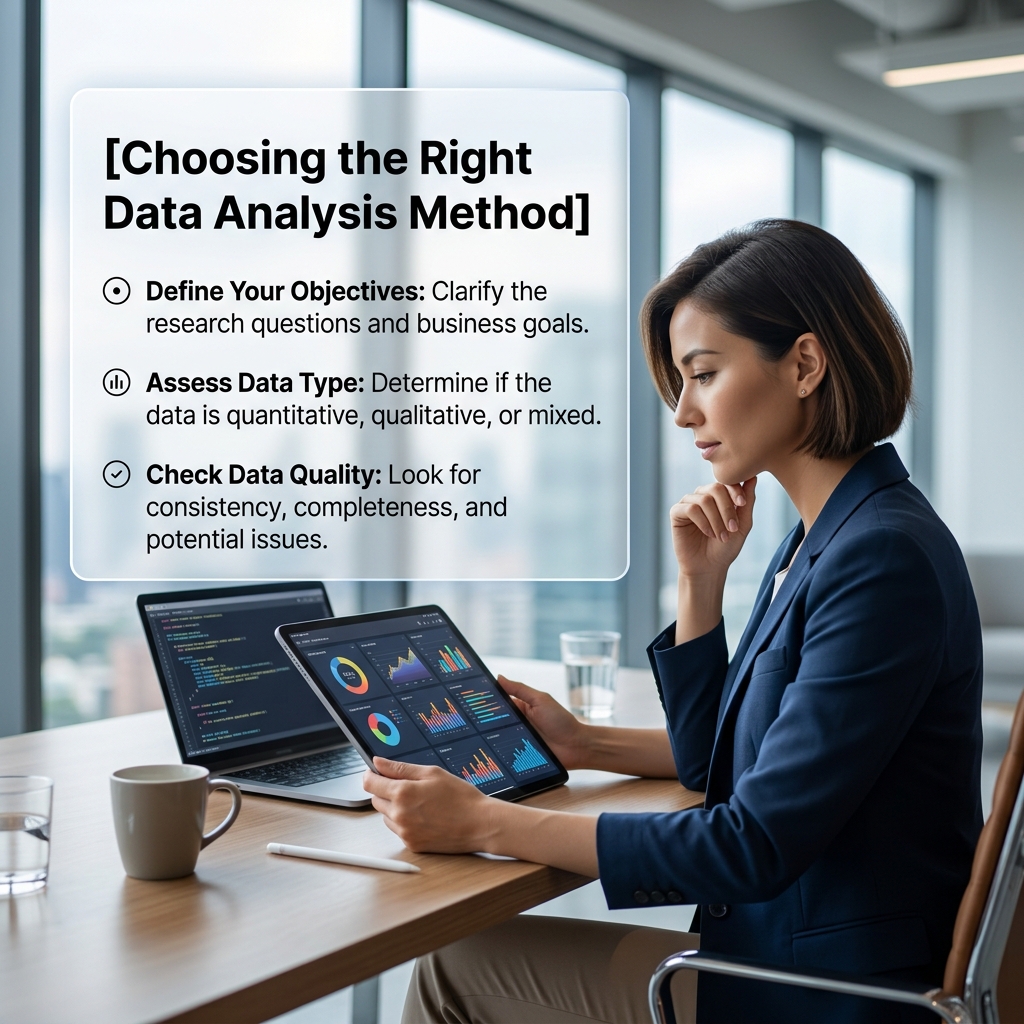
7. Choosing the Right Data Analysis Method
Another common challenge is selecting an inappropriate analytical method.
Different business questions require different approaches.
For example:
- Descriptive analysis explains what happened.
- Diagnostic analysis explores why something happened.
- Predictive analysis estimates what may happen.
- Prescriptive analysis explores what actions should be taken.
Using the wrong method can produce results that appear meaningful but fail to answer the actual business question.
How to Overcome This Problem
Before selecting a method, clearly define:
- What question needs to be answered?
- What data is available?
- What type of result is required?
- Who will use the result?
- What decision will the analysis support?
Start with the business question instead of starting with the tool.
8. Data Security and Privacy
Data analysis often involves sensitive information.
Customer databases may contain names, contact details, transaction information, behavioral data, or other personal information.
Poor security practices can expose organizations to data breaches, regulatory problems, and loss of customer trust.
How to Improve Data Security
Organizations should:
- Limit access to sensitive information
- Use role-based permissions
- Encrypt sensitive data
- Remove unnecessary personal information
- Monitor data access
- Establish security policies
- Follow applicable privacy regulations
Security should be considered throughout the entire data lifecycle rather than only after analysis is complete.
9. Bias in Data and Analysis
Data does not automatically produce objective conclusions.
Bias can enter through:
- Data collection
- Sampling
- Missing information
- Historical decisions
- Question design
- Analyst assumptions
- Algorithmic processes
For example, if a dataset represents only one segment of customers, an analysis based on that dataset may not accurately describe the entire customer base.
How to Reduce Analytical Bias
Analysts should:
- Review how data was collected
- Check whether the sample is representative
- Identify missing groups
- Compare multiple data sources
- Test assumptions
- Conduct sensitivity analysis
- Have other analysts review important findings
The goal is not to eliminate every possible source of bias but to identify and manage it.
10. Difficulty Interpreting Complex Data
A dataset can contain valuable information but still be difficult to understand.
Complex relationships, multiple variables, unusual patterns, and large datasets can make interpretation challenging.
An analyst may identify a correlation between two variables, for example, without understanding whether another factor is influencing both.
How to Overcome This Challenge
Use a structured analytical process:
- Define the objective
- Explore the data
- Identify patterns
- Test assumptions
- Compare relevant variables
- Validate findings
- Consider alternative explanations
- Connect findings to the business context
Avoid treating every correlation as proof of causation.
11. Poor Data Visualization
Even accurate analysis can become ineffective when the results are presented poorly.
A complicated chart can confuse decision-makers rather than helping them understand the information.
Common visualization problems include:
- Too many charts
- Excessive information
- Unclear labels
- Misleading scales
- Inappropriate chart types
- Lack of context
How to Improve Data Visualization
Choose visualizations based on the question being answered.
For example:
- Line charts: trends over time
- Bar charts: category comparisons
- Scatter plots: relationships between variables
- Maps: geographic patterns
- Tables: detailed values
- Dashboards: multiple related metrics
Keep the design simple and highlight the most important insight.
12. Turning Analysis Into Action
One of the most overlooked data analysis challenges is converting insights into decisions.
An analyst may produce an excellent report, but if business leaders do not understand what action to take, the analysis has limited value.
How to Turn Insights Into Decisions
Every analytical report should ideally answer:
- What happened?
- Why did it happen?
- Why does it matter?
- What should we do next?
- How will success be measured?
For example, instead of saying:
Website conversion rate decreased by 15%.
A stronger insight would explain:
Conversion rate decreased by 15% after mobile page load times increased, suggesting that improving mobile performance should be prioritized.
This makes the analysis actionable.
Businesses can also use data reporting to transform business decisions by connecting analytical findings with measurable business goals.
A Simple Framework for Overcoming Data Analysis Challenges
Businesses can create a repeatable process to reduce common problems.
Step 1: Define the Business Question
Start with a clear question rather than collecting data without a purpose.
Step 2: Identify Relevant Data
Determine which sources contain information that can help answer the question.
Step 3: Check Data Quality
Look for:
- Missing values
- Duplicates
- Errors
- Outliers
- Inconsistent formats
- Outdated records
Step 4: Clean and Prepare the Data
Standardize, transform, validate, and organize the dataset before performing deeper analysis.
Step 5: Select the Appropriate Method
Choose analytical techniques based on the business question and data characteristics.
Step 6: Analyze and Validate
Look for patterns while testing assumptions and checking whether the findings are reliable.
Step 7: Visualize the Findings
Use simple and relevant charts or dashboards.
Step 8: Communicate the Insight
Explain what the results mean in clear business language.
Step 9: Take Action
Connect insights to specific business decisions.
Step 10: Monitor Results
Measure whether the recommended action actually improves performance.
Best Practices for Better Data Analysis
Organizations can reduce many data analysis challenges by following several best practices:
Establish Data Governance
Create clear policies for how data is collected, stored, managed, accessed, and used.
Automate Repetitive Tasks
Automation can reduce manual errors in data collection, cleaning, reporting, and monitoring.
Document Data Sources
Maintain documentation explaining where data comes from, what each field means, and how it should be used.
Create Standard Definitions
Make sure different teams use the same definitions for important metrics.
For example, everyone should agree on what qualifies as a “conversion,” “active customer,” or “qualified lead.”
Validate Before Reporting
Never assume that a dashboard or report is correct simply because it was generated automatically.
Perform quality checks before important decisions are made.
Keep Improving Analytical Skills
Data tools continue to evolve, so analysts should regularly improve their technical, statistical, and communication skills.
Data Analysis Challenges vs. Data Analytics Challenges

The terms data analysis and data analytics are often used interchangeably, but they can have slightly different meanings.
Data analysis generally focuses on examining data to understand patterns, relationships, and findings.
Data analytics is a broader discipline that can include data collection, preparation, analysis, visualization, reporting, and decision-making.
For a deeper comparison, see Business Intelligence vs. Data Analytics.
Understanding these distinctions can help businesses build clearer analytics strategies.
Conclusion
Data analysis can provide valuable insights, but the quality of those insights depends on the quality of the entire analytical process. Challenges such as poor data quality, missing information, duplicate records, data integration, bias, security risks, and limited analytical skills can reduce the effectiveness of data-driven decision-making.
The solution is not simply to purchase more advanced analytics software. Businesses need a reliable process for collecting, cleaning, validating, analyzing, visualizing, and communicating data.
By establishing data governance, improving data quality, developing analytical skills, automating repetitive processes, and connecting insights to clear business objectives, organizations can overcome many common data analysis challenges.
Ultimately, successful data analysis is not about having the most data. It is about having reliable data, asking the right questions, and turning insights into meaningful action.
Frequently Asked Questions
1. What are the biggest challenges in data analysis?
The biggest challenges include poor data quality, missing information, duplicate records, data integration problems, large datasets, lack of analytical skills, bias, security concerns, and difficulty communicating insights.
2. Why is data quality important in data analysis?
Data quality directly affects analytical accuracy. Inaccurate, incomplete, inconsistent, or outdated data can produce misleading results and poor business decisions.
3. How can businesses improve data quality?
Businesses can improve data quality through validation, data cleaning, deduplication, standardization, data governance, regular audits, and continuous monitoring.
4. What should analysts do with missing data?
Analysts should first determine why the data is missing. Depending on the situation, they may remove affected records, estimate missing values, collect additional information, or flag the missing values for further investigation.
5. How do duplicate records affect data analysis?
Duplicate records can inflate totals, distort averages, increase customer counts, and create misleading trends. Removing or properly handling duplicates is therefore essential.
6. Why is data integration difficult?
Data integration is difficult because different systems may use different formats, structures, identifiers, and definitions. Standardization and proper data pipelines can reduce these problems.
7. How does bias affect data analysis?
Bias can cause analytical results to overrepresent or underrepresent certain groups or patterns. This can lead to inaccurate conclusions and poor decisions.
8. What skills are important for data analysis?
Important skills include statistics, critical thinking, data visualization, spreadsheet analysis, SQL, programming, business intelligence, and communication.
9. How can data visualization improve analysis?
Effective visualization makes complex information easier to understand. It helps decision-makers identify trends, comparisons, patterns, and anomalies more quickly.
10. What is the difference between data analysis and data analytics?
Data analysis generally focuses on examining and interpreting data, while data analytics can cover the broader process of collecting, preparing, analyzing, visualizing, and using data for decision-making.
11. How can small businesses overcome data analysis challenges?
Small businesses can start with a few important metrics, use affordable analytics tools, maintain clean datasets, automate reporting where possible, and focus on insights directly connected to business goals.
12. What is the best way to overcome data analysis challenges?
The best approach is to create a structured process that includes clear objectives, reliable data collection, data cleaning, appropriate analytical methods, validation, effective visualization, and actionable recommendations.